Desktop analytics // Windows 64-bit

The analysis bench for test & yield engineers.

Load STDF, CSV, Excel or a live database. Explore millions of rows, build the charts test engineers actually use — wafer maps, cumulative probability, box plots — and export Word or PDF reports. No scripting required.

STDF native1,000,000,000 cellsCSV · Excel · SQLWord · PDF reports
SensiDataPower

↑ Click the menu to switch views

Input STDF · CSV · Excel · Text/Databases Oracle · SQL Server · MySQL · PostgreSQL +more/Output Word · PDF/Platform Windows 64-bit

Capabilities

Everything from raw test log to signed-off report.

One desktop tool covers the workflow a test or yield engineer repeats every day — connect, query, visualize, and document.

Data connectivity

Read CSV and any delimited text, Excel, plain text and STDF. Connect to Oracle, SQL Server, MySQL, PostgreSQL, Firebird, SQLite, DB2, Access and more via Universal Data Access components.

STDF · CSV · XLSX · SQL

Charts that fit the job

Box plots, histograms with auto or user-defined bins, cumulative and logarithmic probability plots, XY cross-correlation, parametric and pass/fail wafer maps. Switch themes and rebuild dynamically.

7 chart families

Visual query builder

Build complex SQL with a drag-and-drop interface that suits both newcomers and seasoned query writers. Auto-generate, save and rerun the queries you depend on.

Active Query Builder

A grid built for scale

Work tabular data up to a billion cells — 1,000 columns by a million rows, bounded only by your memory. Insert and delete rows and columns, derive new columns from formulas, group and filter in a click.

10⁹ cells

Reports in one pass

Pick your variables and generate a report that combines charts and statistics, then save it straight to Word or PDF — ready to share with the line, the customer or the audit file.

Word · PDF export

Speaks STDF

The Standard Test Data Format is the ATE industry's common language for raw test data. SensiDataPower reads it directly, so data from different testers lands ready to analyze.

ATE standard

Data visualization

See the shape of your data, not just the numbers.

The plots test and yield engineers reach for first — rendered straight from your loaded data.

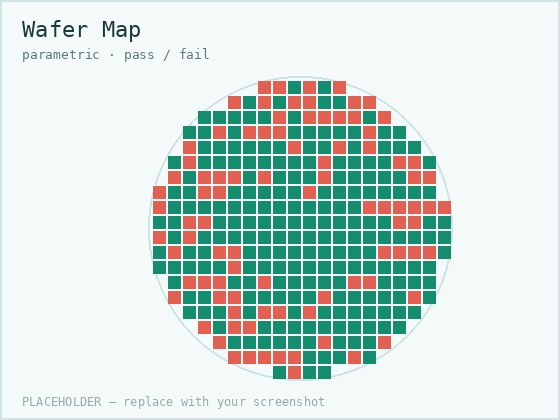
Wafer mapparametric · pass/fail
Wafer map plot coloured by bin
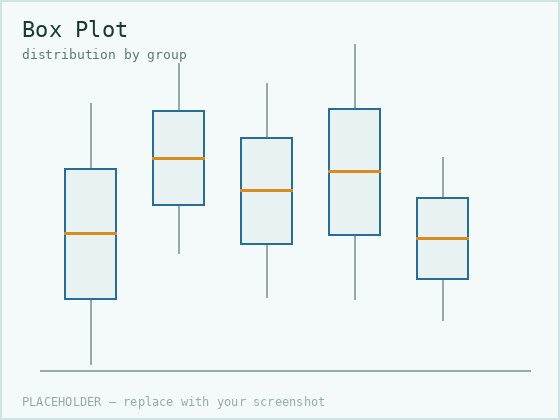
Box plotdistribution by group
Box plot showing distribution by group
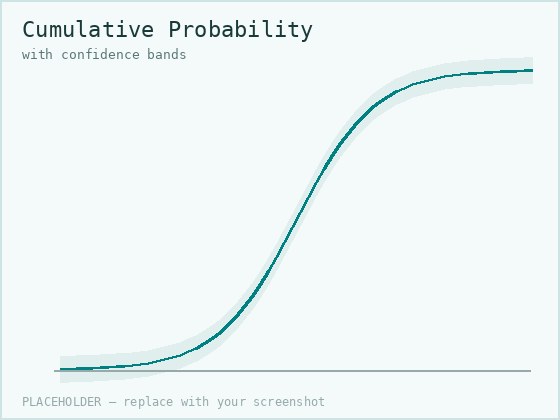
Cumulative probabilityconfidence bands
Cumulative probability plot
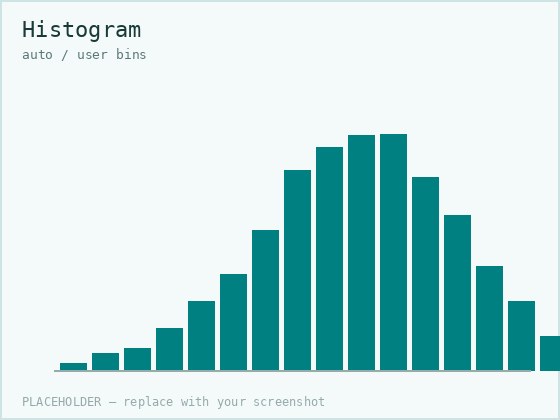
Histogramauto / user bins
Histogram with bins

Data I/O

Bring data in from almost anywhere.

File formats and database engines SensiDataPower connects to out of the box.

File formats

STDFCSVDelimited textExcelPlain text

Database engines

OracleSQL ServerMySQLPostgreSQLInterbaseFirebirdSQLiteDB2AccessAdvantageAdaptive Server

Overview

Two minutes, start to finish.

A quick walk through loading data, building charts, and exporting a report.

Put SensiDataPower on your bench.

Full version for Windows 64-bit. No expiry, no licence key — install and start analyzing your test data today.

↓ Download full version
Windows 10 / 11 · 64-bit · Expiration: unlimited

Contact

Questions, or a format you'd like supported?

Tell me what you're analyzing and I'll point you to the right starting workflow. If SensiDataPower helps your work and you'd like to support its upkeep, a donation keeps the tool maintained and free.

♥ Support the project